Weekly Coding Challenge
Every week, we pick a real-life project to build your portfolio and get ready for a job. All projects are built with ChatGPT as co-pilot!
Start the ChallengePodcast: Code Sets You Free
A tech-culture podcast where you learn to fight the enemies that blocks your way to become a successful professional in tech.
Listen the podcastDescriptive Statistics
Descriptive statistics
Descriptive statistics is a branch of statistics that deals with collecting, analyzing, interpreting, and presenting data in an organized and effective manner. Its main objective is to provide simple and understandable summaries of the main characteristics of a data set, without making inferences or predictions about a larger population.
Guide to descriptive statistics in Python
Measures of central tendency
Measures of central tendency** are numerical values that describe how data are centralized or grouped in a set. They are essential in statistics and data analysis because they provide us with a summary of information, allowing us to quickly understand the general characteristics of a data distribution without having to look at each value individually.
Mean
The central value of a set of numerical data.
1import statistics as stats
2
3data = [10, 20, -15, 0, 50, 10, 5, 100]
4mean = stats.mean(data)
5print(f"Mean: {mean}")
Median
Average value when data are sorted.
1median = stats.median(data)
2print(f"Median: {median}")
Mode
Value that occurs most frequently.
1mode = stats.mode(data)
2print(f"Mode: {mode}")
These measures are fundamental for describing and analyzing data distributions.
Measures of dispersion
Measures of dispersion** are numerical values that describe how varied the data are in a set. While measures of central tendency tell us where the data are "centered", measures of dispersion show us how much those data "spread out" or "vary" around that center.
Range
The difference between the maximum value and the minimum value of a data set.
1range_ = max(data) - min(data)
2print(f"Range: {range_}")
Variance and standard deviation
Both metrics measure the same thing. They indicate how far, on average, the values are from the mean. However, the standard deviation is a measure used to be able to work with initial units of measurement, while the variance, although at first sight it may seem an unnecessary calculation, is calculated to be able to obtain other parameters.
1variance = stats.variance(data)
2std = stats.stdev(data)
3print(f"Variance: {variance}")
4print(f"Standard deviation: {std}")
Position measures
The position measures are statistics that tell us the location or position of a specific value within a data set.
Percentiles and quantiles
These are measures that deal with how a data set can be divided into specific parts. These measures are used to understand and describe the distribution of data.
- Percentile: Divides a data set into 100 equal parts. The k-th percentile indicates the value below which k% of the observations fall.
- Quantile: Divides a data set into equal parts, depending on the type. Quartiles divide the data into four parts, quintiles into five, and so on.
Shape measures
The shape measures describe how the values in a data set are distributed in relation to the measures of central tendency. Specifically, they tell us the nature of the distribution, whether it is symmetric, skewed, or has heavy tails, among others.
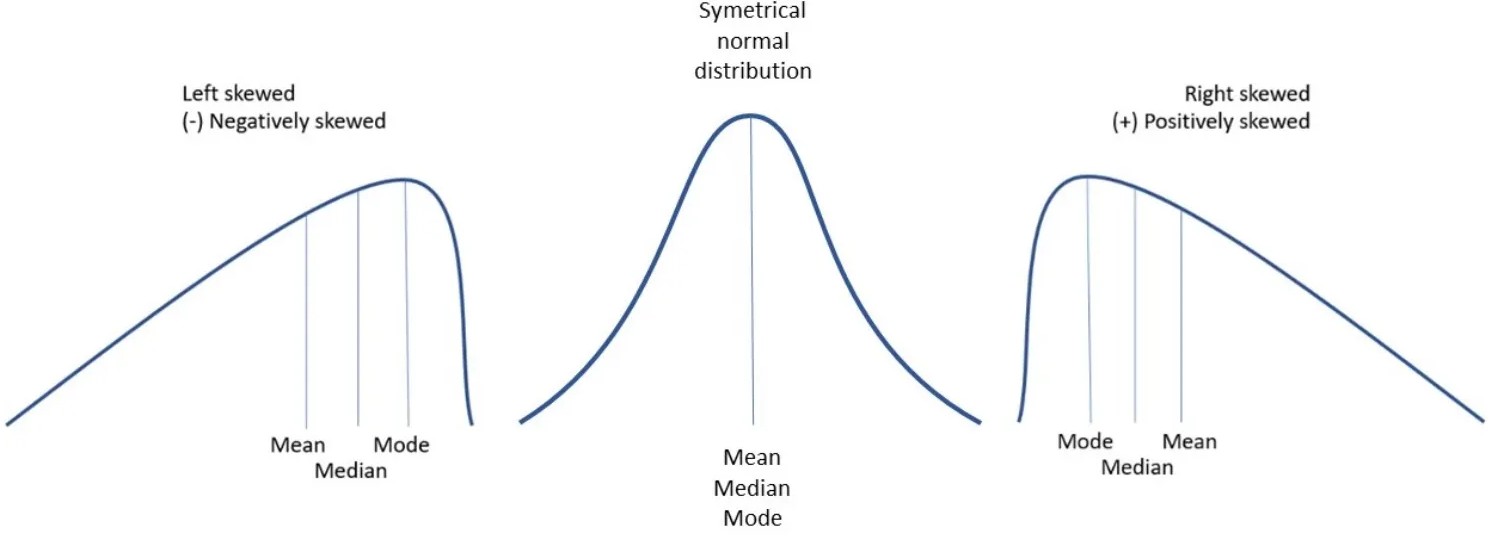
Skewness
Measures the lack of symmetry in the data distribution. A positive skewness indicates that most of the data are on the left and there are a few very high values on the right. A negative skewness indicates that there are more unusual low values. If it is close to zero it suggests that the data are quite symmetrical.
1from scipy.stats import skew
2
3skewness = skew(data)
Kurtosis
Measures the concentration of data around the mean. It is used to describe a distribution and is part of some normality tests. A positive kurtosis indicates a sharper peak compared to the normal distribution. A negative kurtosis indicates a flatter peak and lighter tails. A kurtosis close to zero is ideal, as it suggests a shape similar to that of the normal distribution.

1from scipy.stats import kurtosis
2
3kurt = kurtosis(data)
Data visualization
In this section, it is essential to visualize the data available to us. Histograms, bar charts and scatter plots are usually used, depending on the type of data.